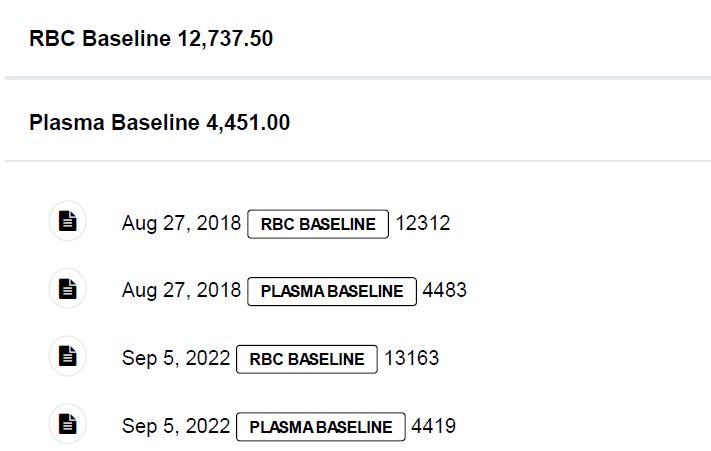
Example of data for work season from September to November
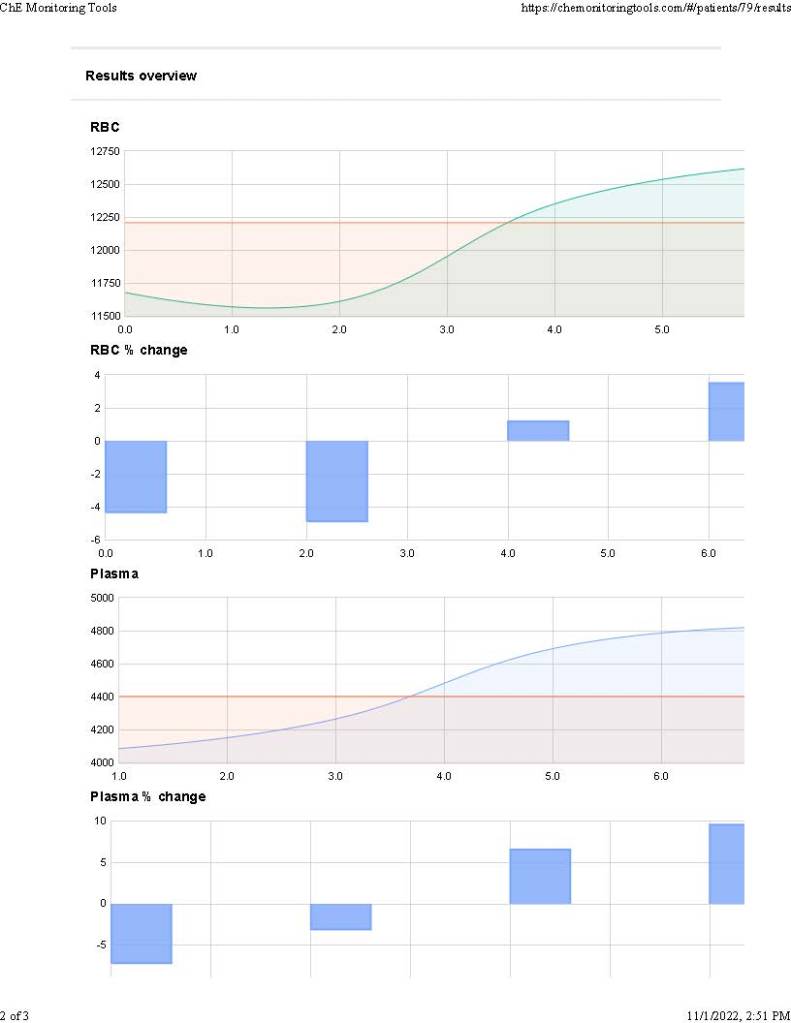
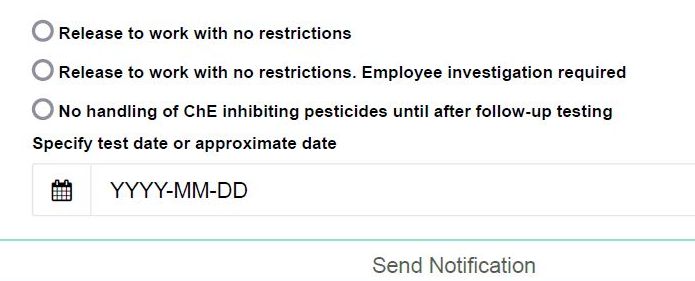
Activity levels from 2022 with baseline levels from 2018Graphic display of activity and % inhibition -RBC Che (top) ; Plasma ChE bottomNotification options from results page – top option is appropriate because % inhibition is well below 20%; sent simultaneously to employees and employers; option to receive as email or text message; follow-up by site log-on or request to review by phone with ordering provider